
뉴질랜드 부동산 시장, 지역별 양극화 심화
NZ’s regional property markets diverge since peak

In this Pulse article, Kelvin Davidson, Chief Property Economist for Cotality NZ (formerly CoreLogic), explores the significant regional divergences that have emerged since the post-COVID peaks.
Following the dramatic growth in property values during the COVID-era boom, New Zealand’s housing market has entered a more fragmented phase. While national indicators suggest a stabilisation in values, the underlying regional picture tells a far more complex story — one marked by stark divergences in performance, resilience, and recovery.
New analysis from Cotality reveals that while some regional markets have already surged past previous highs, others — particularly in parts of Auckland and Wellington — remain well below their cyclical peaks.
In fact, over a dozen areas are still more than 20% off their highs, highlighting how uneven the past few years have been across the country.
As mortgage rates ease and affordability improves in select locations, this Pulse takes a closer look at the forces shaping these regional variations — shedding light on affordability trends, economic drivers, and standout performers such as Hamilton, Queenstown, and much of Canterbury.
Some areas are back to peak, others languishing
Cotality’s latest hedonic Home Value Index shows there were three areas that set their own new record highs for property values in April – New Plymouth at $711,699, Westland at $493,500, and Kaikoura at $775,443. While the early signs of growth have recently re-emerged in many other parts of the country – driven by lower mortgage rates – the gap compared to where property values were at the peak remains significant.
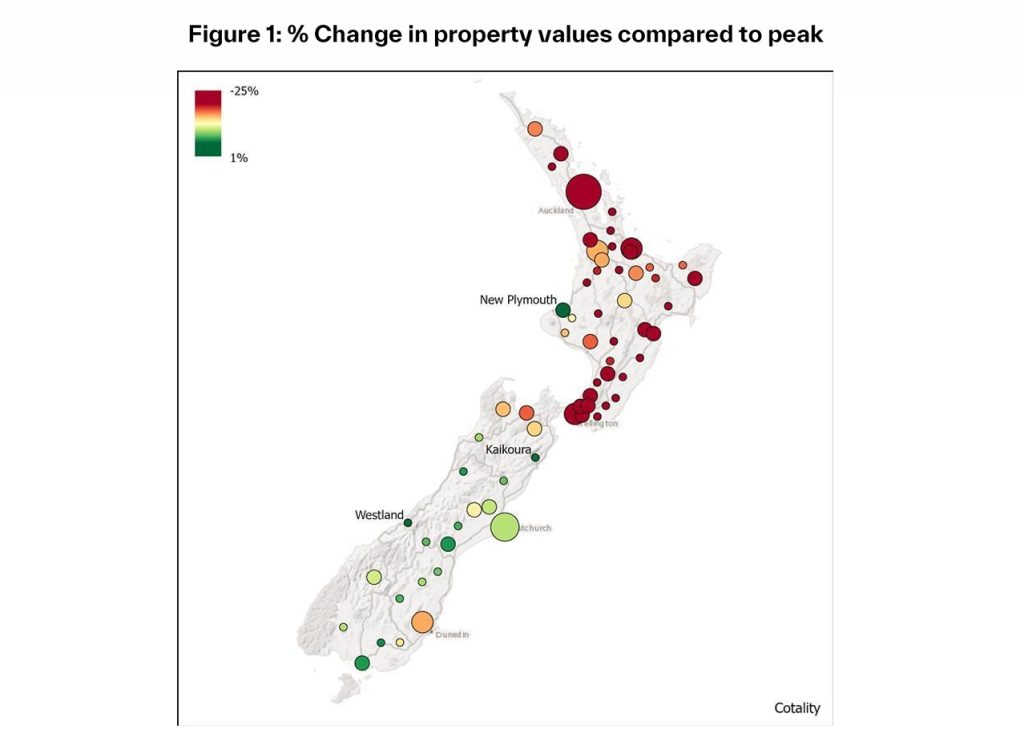
Indeed, 13 areas still have property values more than 20% below the peak, all of them either in the Auckland or Wellington regions, apart from Wairoa (-21%).
Both Lower Hutt and Upper Hutt sit at -24% compared to the peak, with Wellington City at -23% and Porirua -22%. Waitakere is -23%, with Papakura and Manukau at -22% apiece. ‘Rural’ areas of Wellington Region such as South Wairarapa and Carterton sit at -21%.
A story of South Island affordability?
Another distinct trend that stands out is the north-south split – with the South emerging as a clear winner when it comes to affordability.
Take areas such as Grey, Buller, Clutha, and Gore, where the current figure for mortgage payments as a percentage of gross median household income is less than 30% (versus 46% nationally).
By contrast, Tauranga’s mortgage affordability measure is still 54% and Kapiti Coast sits at the same level.
“Affordability remains a key pillar of housing demand, and in many South Island regions we’re seeing that balance become a little more favourable for buyers,” said Kelvin Davidson, Chief Property Economist at Cotality NZ.
Areas of interest
- Hamilton’s recent strength.Compared to the other main centres in the North Island, Hamilton hasn’t fallen as far (-10% from the peak) in the past three years or so and has been showing stronger signs of growth more recently too. Since January, values are up by +2.1% in Hamilton, matching Christchurch’s figure, and ahead of Auckland at +0.9% and Tauranga (which has edged down by -0.4%). The buoyancy of the surrounding rural economy at present may be supporting Hamilton’s market, with other factors potentially including the increased connectivity to Auckland via improved roading.
- Queenstown’s continued prominence.Despite an elevated median value of $1.66m, well ahead of second-placed North Shore (Auckland) at $1.31m, Queenstown has remained a reasonably buoyant market – ‘only’ down by 5% from the peak – still appealing to overseas buyers who can navigate the rules and also wealthy domestic investors.
- Canterbury’s resilience.Of the 17 areas that are back within 5% of their peak, eight are in Canterbury, including Christchurch, Waimakariri, Ashburton, and Timaru. This comes even though new housing supply volumes have been high across large parts of the Region and signals that property demand has been rising to match construction.
Looking ahead
While some of New Zealand’s largest urban centres remain well below their recent market peaks, a return to strong growth is not guaranteed. Structural factors—such as Auckland’s substantial pipeline of new townhouse developments and ongoing fiscal tightening in Wellington—may continue to weigh on short-term performance.
Nevertheless, improved mortgage affordability and early signs of broader economic recovery are likely to support renewed value growth across many parts of the country in 2025, including Auckland and Wellington. As market fundamentals continue to evolve, buyers and investors alike will be watching closely for signs of renewed momentum.

뉴질랜드 부동산 시장, 지역별 양극화 심화
코어로직에서 사명을 변경한 코탈리티(Cotality) 뉴질랜드의 수석 부동산 경제학자 켈빈 데이비슨, 최근 지역별 시장 격차 분석
코로나 이후 최고점 대비 지역별 시장 성과 엇갈려
코로나19 팬데믹 이후 급등했던 부동산 시장이 최근 들어 안정세를 보이고 있는 가운데, 뉴질랜드의 부동산 시장은 지역에 따라 극명하게 갈리고 있는 것으로 나타났다. 전국 평균 지표는 가치 안정화를 시사하고 있지만, 실제 지역별로는 회복 속도나 가격 수준에서 현저한 차이가 드러나고 있다.
부동산 정보 분석업체 코탈리티(Cotality)의 최신 분석에 따르면, 일부 지역에서는 이미 팬데믹 기간의 정점을 넘어선 반면, 오클랜드와 웰링턴 일부 지역은 여전히 최고점 대비 크게 낮은 수준을 유지하고 있다.
실제로 전국적으로 12개 이상의 지역이 정점 대비 20% 이상 가격이 하락한 상태이며, 이는 지난 몇 년간 지역 간 성과와 회복력이 얼마나 불균형했는지를 잘 보여준다.
최근 주택담보대출(모기지) 금리 하락과 일부 지역에서의 구매 여력 개선이 이어지면서, 이번 분석에서는 이러한 지역별 격차를 만들어내는 다양한 요인들—경제 상황, 구매 여력 변화, 두드러진 강세 지역 등에 주목했다.
일부 지역은 최고점 회복, 일부는 여전히 부진
코탈리티의 최신 ‘헤도닉 주택 가치 지수(Hedonic Home Value Index)’에 따르면, 지난 4월 기준으로 뉴플리머스(New Plymouth·71만1699달러), 웨스트랜드(Westland·49만3500달러), 카이코우라(Kaikoura·77만5443달러) 등 세 지역은 새로운 최고 주택 가치를 기록했다.
비록 전국적으로 일부 지역에서 성장세가 재개되는 조짐이 보이고는 있지만, 여전히 팬데믹 시기 정점 대비 현저한 차이를 보이고 있는 지역들이 많다.
특히 오클랜드 및 웰링턴 지역을 중심으로 13개 지역은 정점 대비 20% 이상 하락한 상태다. 웰링턴 시(-23%), 로어헛(Lower Hutt·-24%), 어퍼헛(Upper Hutt·-24%), 포리루아(Porirua·-22%)가 대표적이며, 오클랜드 내에서는 와이타케레(-23%), 파파쿠라 및 마누카우(-22%)도 큰 폭의 하락세를 기록하고 있다. 웰링턴 인근의 사우스와이라라파(South Wairarapa)와 카터턴(Carterton) 역시 각각 21% 하락한 상태다.
남섬의 구매 여력 ‘주목’… 북섬과 뚜렷한 대조
최근 가장 주목되는 흐름 중 하나는 남북섬 간의 격차로, 특히 남섬의 구매 여력(affordability) 측면에서 뚜렷한 우위를 보이고 있다.
그레이(Grey), 불러(Buller), 클루서(Clutha), 고어(Gore)와 같은 지역은 모기지 상환금이 가구 중간소득에서 차지하는 비율이 30% 미만으로, 전국 평균(46%)보다 훨씬 낮은 수준이다.
반면, 타우랑가(Tauranga)와 카피티 코스트(Kapiti Coast)는 여전히 54%에 달하며 높은 부담을 보이고 있다.
코탈리티의 켈빈 데이비슨 수석 경제학자는 “구매 여력은 주택 수요의 핵심 요인 중 하나이며, 남섬의 여러 지역에서는 이 균형이 구매자에게 좀 더 유리하게 작용하고 있다”고 평가했다.
회복세 보이는 주요 지역들
-
해밀턴(Hamilton)
해밀턴은 북섬의 주요 도시 중에서 최근 몇 년간 가격 하락폭이 비교적 작았으며(정점 대비 -10%), 올해 들어서도 강한 회복세를 보이고 있다. 1월 이후 주택 가격은 +2.1% 상승해 크라이스트처치와 동일한 수준을 기록했으며, 이는 오클랜드(+0.9%)와 타우랑가(-0.4%)를 상회하는 수치다. 지역 농촌 경제의 탄탄함과 오클랜드와의 교통 연결성 개선 등이 긍정적으로 작용한 것으로 분석된다. -
퀸스타운(Queenstown)
중간 주택 가격이 166만 달러로 전국 최고 수준이지만, 가격 하락은 정점 대비 -5%에 불과하다. 외국인 투자자 및 고소득 국내 투자자들의 꾸준한 관심이 시장을 지지하고 있는 것으로 보인다. -
캔터베리(Canterbury)
정점 대비 5% 이내로 회복한 17개 지역 중 8곳이 캔터베리에 위치해 있다. 크라이스트처치, 와이마카리리, 애쉬버턴, 티마루 등이 포함된다. 높은 신규 주택 공급에도 불구하고 수요가 이를 뒷받침하며 시장이 탄탄하게 유지되고 있는 셈이다.
전망… 2025년 완만한 회복 기대
오클랜드와 웰링턴 등 주요 도시들이 여전히 최근 최고점 대비 낮은 수준을 보이고 있지만, 강한 반등이 바로 나타날 것으로 보기는 어렵다. 오클랜드에서는 타운하우스 개발이 대규모로 진행 중이고, 웰링턴은 정부 지출 축소 등의 구조적 요인이 단기 시장 회복을 제약할 수 있기 때문이다.
그럼에도 불구하고, 개선된 모기지 여건과 초기 경제 회복 신호는 2025년부터 오클랜드와 웰링턴을 포함한 전국 주요 지역에서 완만한 가치 회복을 이끌 수 있을 것으로 기대된다. 시장의 기본 여건이 바뀌면서, 구매자와 투자자들의 주목도는 더욱 높아질 전망이다.